Performance: Boosting Your Site Speed and User Experience
The Performance category in Chrome Lighthouse measures how quickly your website loads and becomes usable. It evaluates key metrics like First Contentful Paint (FCP), Largest Contentful Paint (LCP), Total Blocking Time (TBT), and Cumulative Layout Shift (CLS) — all of which play a vital role in user experience and SEO. Faster, more responsive websites rank higher on search engines, keep visitors engaged, and drive better conversions.
Understanding and optimizing your site’s performance can feel overwhelming, but learning about Core Web Vitals is a great place to start. Our collection of in-depth articles breaks down each performance metric, explains why it matters, and provides practical tips for improvement. Whether you're a developer, marketer, or site owner, staying informed helps you make data-driven decisions to deliver a faster, smoother experience for your users.
Explore our articles and discover how to master performance optimization step by step!
Time To First Byte
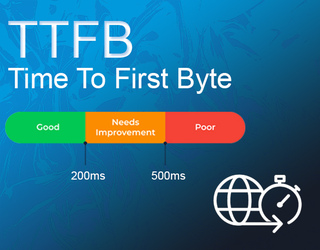
Time To First Byte (TTFB) is a web performance metric that measures how quickly a user’s browser receives the first byte of data from the server after making an HTTP request. A fast TTFB indicates a responsive server and optimized backend, which directly impacts user experience and SEO rankings. High latency during this phase can cause delays in page rendering and hurt Core Web Vitals scores. Optimizing TTFB involves reducing server processing time, leveraging caching strategies, using Content Delivery Networks (CDNs), and minimizing database or application logic delays. Monitoring TTFB helps diagnose and fix server-side performance bottlenecks effectively.
Cumulative Layout Shift
Cumulative Layout Shift (CLS) measures how much visible content unexpectedly moves around while a page loads. Sudden layout shifts — like buttons jumping or text shifting — frustrate users and lead to accidental clicks, hurting the overall experience. A good CLS score means your site feels stable and polished, boosting user satisfaction and SEO rankings.
Understanding and improving CLS is crucial for optimizing your website’s performance. In our article, we break down what causes layout shifts, how to measure them, and practical techniques to keep your pages steady. Whether you’re a developer or site owner, mastering CLS helps you create smoother, more reliable user experiences. Dive into the full guide to learn more!
First Contentful Paint
First Contentful Paint (FCP) is a performance metric that measures how long it takes for the browser to render the first visible content — such as text, images, or SVGs — after the user navigates to a page. It’s a key signal of perceived load speed and directly influences user trust and engagement. A fast FCP reassures users that the site is loading, even if it’s not yet interactive. Delays in FCP are often caused by slow server response, render-blocking CSS or JavaScript, and unoptimized resources. Optimizing FCP improves both user experience and Core Web Vitals performance.
Largest Contentful Paint
Largest Contentful Paint (LCP) is a Core Web Vitals metric that measures how long it takes for the largest visible content element — typically an image or block of text — to fully render on screen. A fast LCP improves perceived load time, user satisfaction, and SEO performance. Common causes of poor LCP include slow server response, render-blocking resources, unoptimized images, and client-side rendering delays. To optimize LCP, you can use techniques such as server-side rendering, lazy loading, image compression, caching, CDNs, and resource preloading. Monitoring LCP helps ensure your pages load quickly and deliver a smooth user experience.
Time To Interactive
Time To Interactive (TTI) is a performance metric that measures how long it takes for a web page to become fully interactive — meaning it responds quickly to user input without lag. A fast TTI is critical for user experience, especially on mobile, where delays can lead to frustration and abandonment. Slow TTI is often caused by heavy JavaScript execution, long tasks blocking the main thread, or third-party scripts. Optimizing TTI involves code splitting, deferring non-critical JS, minimizing main thread work, and using performance tools like Lighthouse. Monitoring TTI ensures your pages are not just visible but also usable.
Unused JavaScript
Unused JavaScript adds unnecessary weight to your pages, increasing load time and wasting user bandwidth. Lighthouse often highlights this issue when scripts are shipped but never executed or only partially used. This guide explains why unused JavaScript occurs, how it negatively impacts performance metrics like FCP and TTI, and what it means for overall UX and SEO. You’ll also learn practical solutions such as tree-shaking, lazy-loading, code splitting, and server-side optimizations to ensure scripts load only when truly needed.
Largest Contentful Paint
Largest Contentful Paint (LCP) is a Core Web Vitals metric that measures how long it takes for the largest visible content element — typically an image or block of text — to fully render on screen. A fast LCP improves perceived load time, user satisfaction, and SEO performance. Common causes of poor LCP include slow server response, render-blocking resources, unoptimized images, and client-side rendering delays. To optimize LCP, you can use techniques such as server-side rendering, lazy loading, image compression, caching, CDNs, and resource preloading. Monitoring LCP helps ensure your pages load quickly and deliver a smooth user experience.
Render-Blocking Resources
Render-blocking CSS and JavaScript can significantly delay critical rendering, preventing your page from showing meaningful content quickly. These resources stall the browser’s HTML parser, slowing down First Paint, First Contentful Paint (FCP), and Largest Contentful Paint (LCP). This guide breaks down why render-blocking occurs, its impact on user experience and SEO rankings, and proven strategies to fix it. Learn how to eliminate delays with deferral, asynchronous loading, resource inlining, and modern optimization techniques that ensure faster, more responsive web pages across devices.
Defer Offscreen Images
Deferring offscreen images is one of the most effective ways to speed up page load and improve Core Web Vitals. By delaying the loading of below-the-fold images until users actually scroll near them, you can save bandwidth, reduce render-blocking, and create a faster, smoother browsing experience. This guide explains multiple techniques including native loading="lazy", the IntersectionObserver API, and AMP integration. You’ll also find CMS and SaaS implementation tips, code examples, and notes on how deferring offscreen images directly improves metrics such as LCP, FCP, and overall user experience.
Unsized Images
Lighthouse flags “Unsized images” when an image lacks explicit width and height (or a CSS aspect-ratio). Without reserved space, images push content as they load and hurt your CLS score. This guide shows practical fixes for HTML and CSS, responsive images (srcset/sizes,